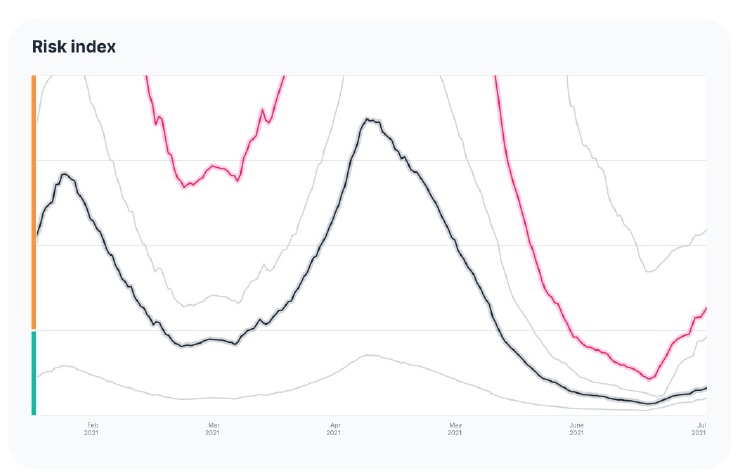
This risk index plot displays how “current” and alternative “configuration” risk indexes vary over time. The variation in risk index is due to the fluctuations of case count data, changes in transmissibility, vaccine effectiveness, or other factors for each of the pathogens included in the model (SARS-CoV-2, influenza, RSV and rhinovirus).